Problem specific parts of the ML pipeline
This page talks in more details about the first six steps in the ML pipeline. These are the steps in the ML pipeline that are most closely related to the problem being solved.
Under Construction
This page is still under construction. In particular, nothing here is final while this sign still remains here.
A Request
I know I am biased in favor of references that appear in the computer science literature. If you think I am missing a relevant reference (outside or even within CS), please email it to me.
Recap and Overview
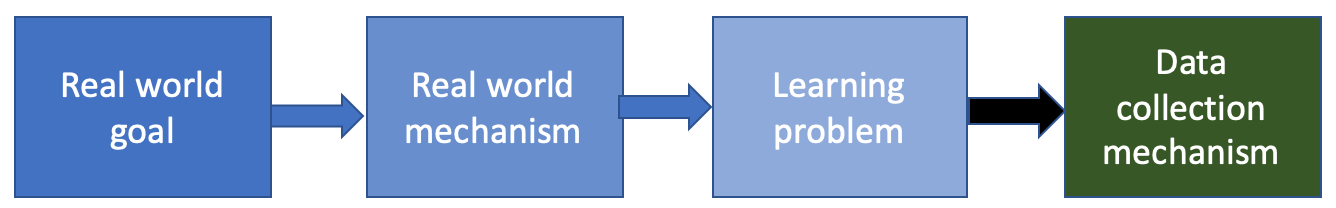
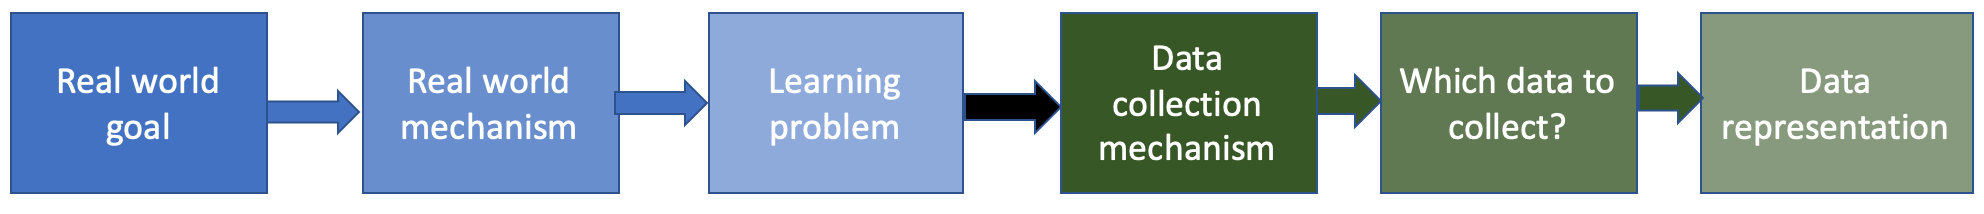
We first recall the ML pipeline we will study in this course, which we saw earlier:
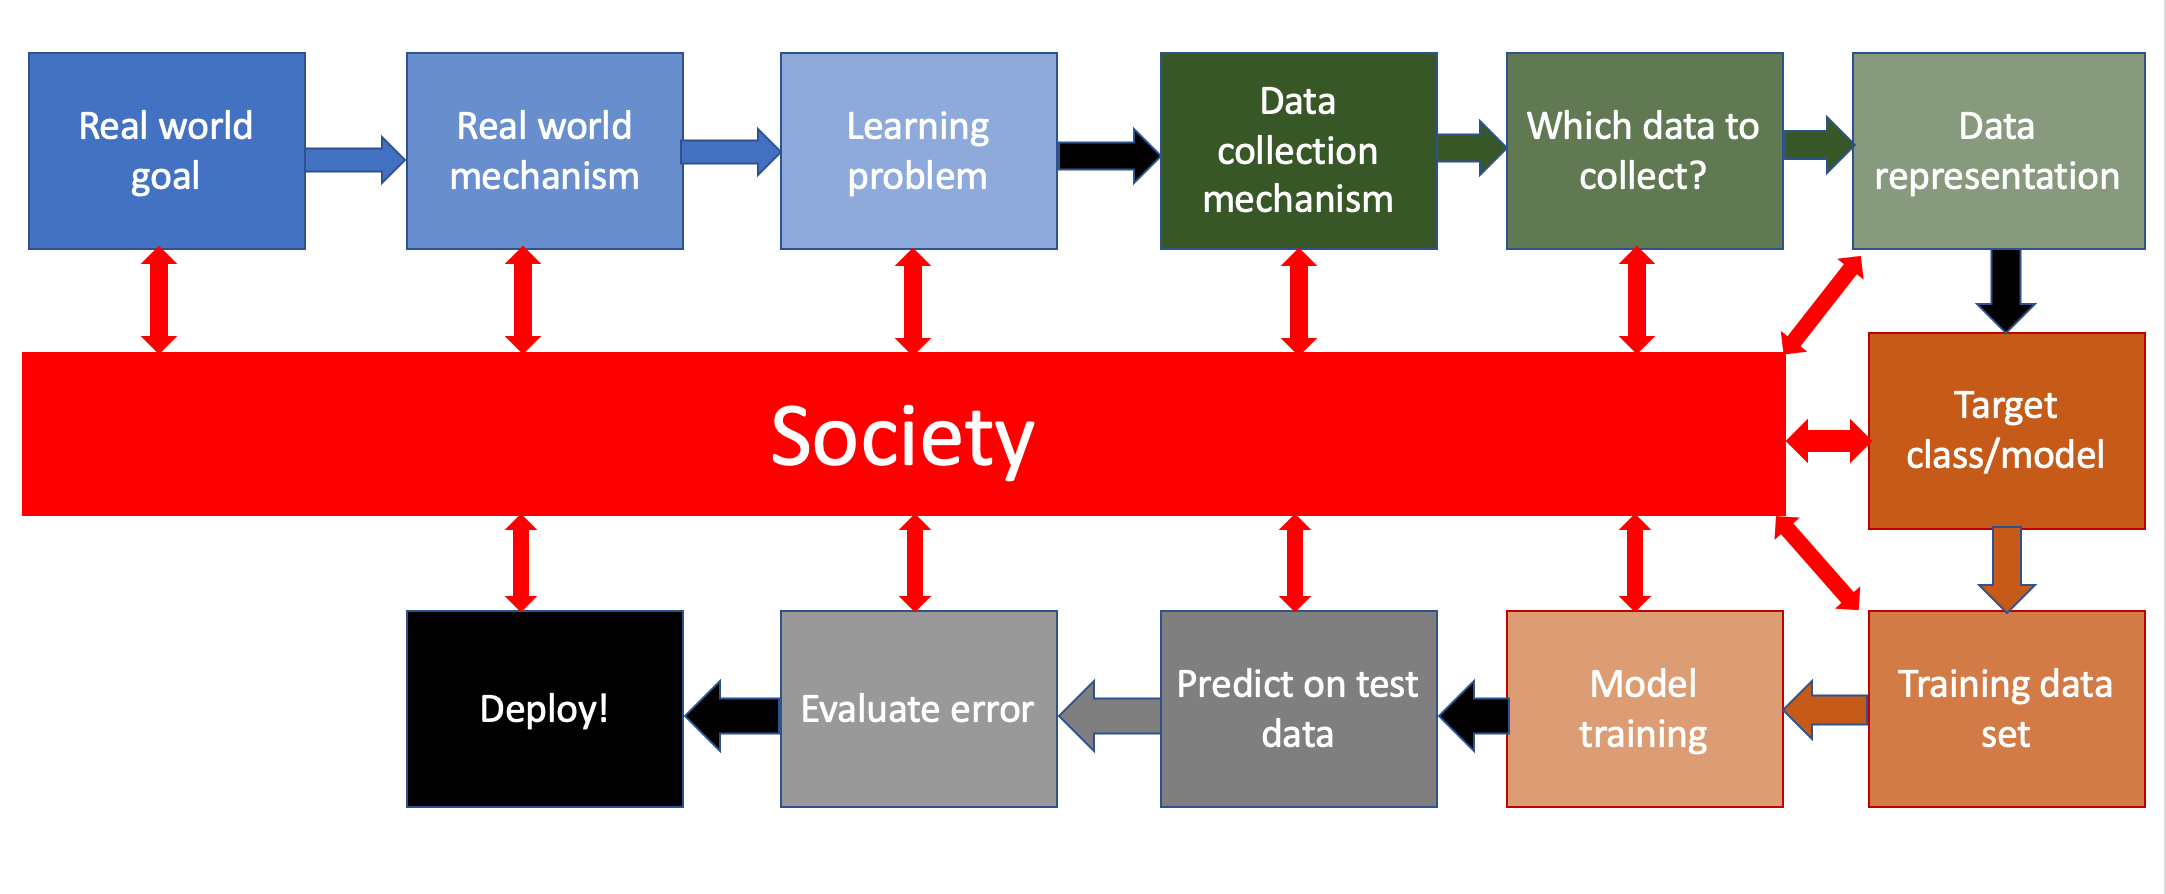
Further, we went through a walkthrough of this ML pipeline for a problem motivated by the COMPAS dataset. However, many of the steps in the ML pipeline became sort of "trivial" since we already had access to the COMPAS dataset. In this note, we will walk through the steps of the ML pipeline again but with three examples to illustrate some of subtleties that did not appear in the previous walkthrough.
Few more walkthroughs
The first problem for the walkthrough will be the one considered in Hal Duame III's blog post on the machine learning pipeline , the second problem is from the Medium article titled Black-Boxed Politics: Opacity is a Choice in AI Systems that we looked at before while the third problem will be picked by students in the lecture. As we go through each step of the ML pipeline, we will discuss how that particular step is applied to the three example problems before making more general observations about that step.We would like to point out that we will only consider the first six steps in the ML pipeline in this note since those are the ones that are most closely related to the problem we are trying to solve (as we had observed earlier).
Acknowledgments
The instantiations for the various steps in the ML pipeline from the first and second problem are (mostly) taken from Hal Duame III's blog post on the machine learning pipeline and the Medium article titled Black-Boxed Politics: Opacity is a Choice in AI Systems respectively. These resources also provide inspiration for some of the rest of the material in these notes.
Real world goal
We start off with the first step in the ML pipeline:
Real world goal: Example 1
Your company wants to increase revenue. A majority of revenue for your company comes from facilitating online ads. Your group has to attain this high level goal.
Real world goal: Example 2
Your hospital learns of a new government program that provides hospitals with additional resources to help manage health of patients with significant needs. The hospital management wants your hospital to utilize these funds since the hospital has been losing money in the last few quarters. However, the funds can only help a (relatively) small fraction of the patients in your hospital.
Real world goal: In-class discussion
Students get to pick a real life problem related to their student life at UB that they would like to be improved. E.g. improve the user experience for the Stampede buses and shuttles .
Real world goal: General thoughts
This is generally the step that is done at the "management" level: these goals are general high level ones that are (for good reason) not specified very explicitly. In order for your group to walk through and instantiate the remaining stages of the ML pipeline, you will need a good understanding of the real life goal in the first place.
Real world mechanism
We now move to the second step in the ML pipeline:
Real world mechanism: Example 1
Since online ads make up a majority of the company's revenue your group decides to improve upon the ad display (with the hope that this can generate more revenue.
Real world mechanism: Example 2
Here you get conflicting demands: the management wants to use the extra funds to cut spending (i.e. keep the current service at their current level) while doctors want to use the extra funds to supplement the existing services (i.e. add on to the existing services).
Real world mechanism: In-class discussion
To be done in class.
Real world mechanism: General thoughts
This step is the first one to make the more amorphous real life goal into something that is more concrete. It is worth noting that:
- It is always a good idea to question whether the choice made in this step is the best way to implement the real life goal. As Hal Duame III's blog post on the machine learning pipeline explicitly mentions: improving ad displays might not be the best option and suggest an alternative could be to build a better product in the first place.
- Sometimes there might be competing mechanisms to achieve the real life goal: e.g. the Medium article presents two different mechanisms from hospital management and doctors.
Further note that if there are competing real world mechanisms, which cannot be reconciled (e.g. in the hospital example above), then one of them will have to be chosen. In the hospital example, presumably there are policies in place to decide which options to take (cost cutting vs. supplementing existing services).
Finally, we note that sometimes the mechanism is picked for convenience. It is not unlikely a real world mechanism is chosen just because it is convenient: e.g. using an existing mechanism is easier than using a mechanism that will need to be created. If you are in such a situation it is definitely worth pondering over why a certain real world mechanism is chosen (over other potential options).
Learning problem
We now move to the third step in the ML pipeline:
Learning problem: Example 1
Your group decides to predict the click through rate , which is a measure of the likelihood that a user will click on your ad. Based on these predictions, you will better place ads.
Learning problem: Example 2
The doctors had their way so your group decides to predict the patients with most need so that they can targeted with the supplementary practice.
Learning problem: In-class discussion
To be done in class.
Learning problem: General thoughts
Unlike the COMPAS walkthrough, where the learning objective was essentially fixed once we reached the third step, this was not the case in the first two examples. Indeed, we saw two ways to decide on the learning problem step from the decisions of the first two steps:
- In the first example on ads display, we used a proxy (i.e. click through rate) for our actual objective from second steps (which was better display ads in order to generate from revenue). The issue with an objective like better placement of ads is that that objective is not something that can be measured directly. In such a case we pick an objective that can be measured (in this case click through rate) with the idea that this proxy will be a good enough approximation of what we want.
- In the second example on the new government program in the hospital, there were two competing objectives/mechanism (cuts down costs vs. adding supplementary support to needy patients) and one of the two options were chosen. In other words, someone made a decision to pick one learning problem over the other. Also in this case someone has to decide what it means to have the "most need" for extra care.
Both of the above are examples illustrating the fact that choosing a learning problem in itself can have consequences later on. This consequences could be in the accuracy of your system (e.g. if using click through rate is the best way to improve ad placement) to beyond (e.g. in deciding to choose patients with most need, we might be overlooking patients who perhaps could have benefited more from the supplemental services). Also pay attention to the convenience trap: i.e. if there are competing learning problems, then wanting to pick once that is either readily available or much easier to measure. In other words, decisions made in this step can have large consequences.
Another option
Note that you can always decide that is NOT appropriate to solve this via a learning problem (e.g. if there is not a good proxy for the actual thing you want to learn and incorrect decisions by your learning outcomes can have outsized consequences (e.g. someone can die)). This default option should be something you should always consider when finalizing this step.
We will come back to this later in the course.
A digression: Jupyter notebook
Before we move to the next step in the pipeline, let us try and familiarize ourselves with Jupyter notebooks:
Loading a dataset
Log on to Google Colab . Then download the Loading a dataset notebook from the notebooks page (here is a direct link). Load the notebook into Google Colab and follow along with the instructions:
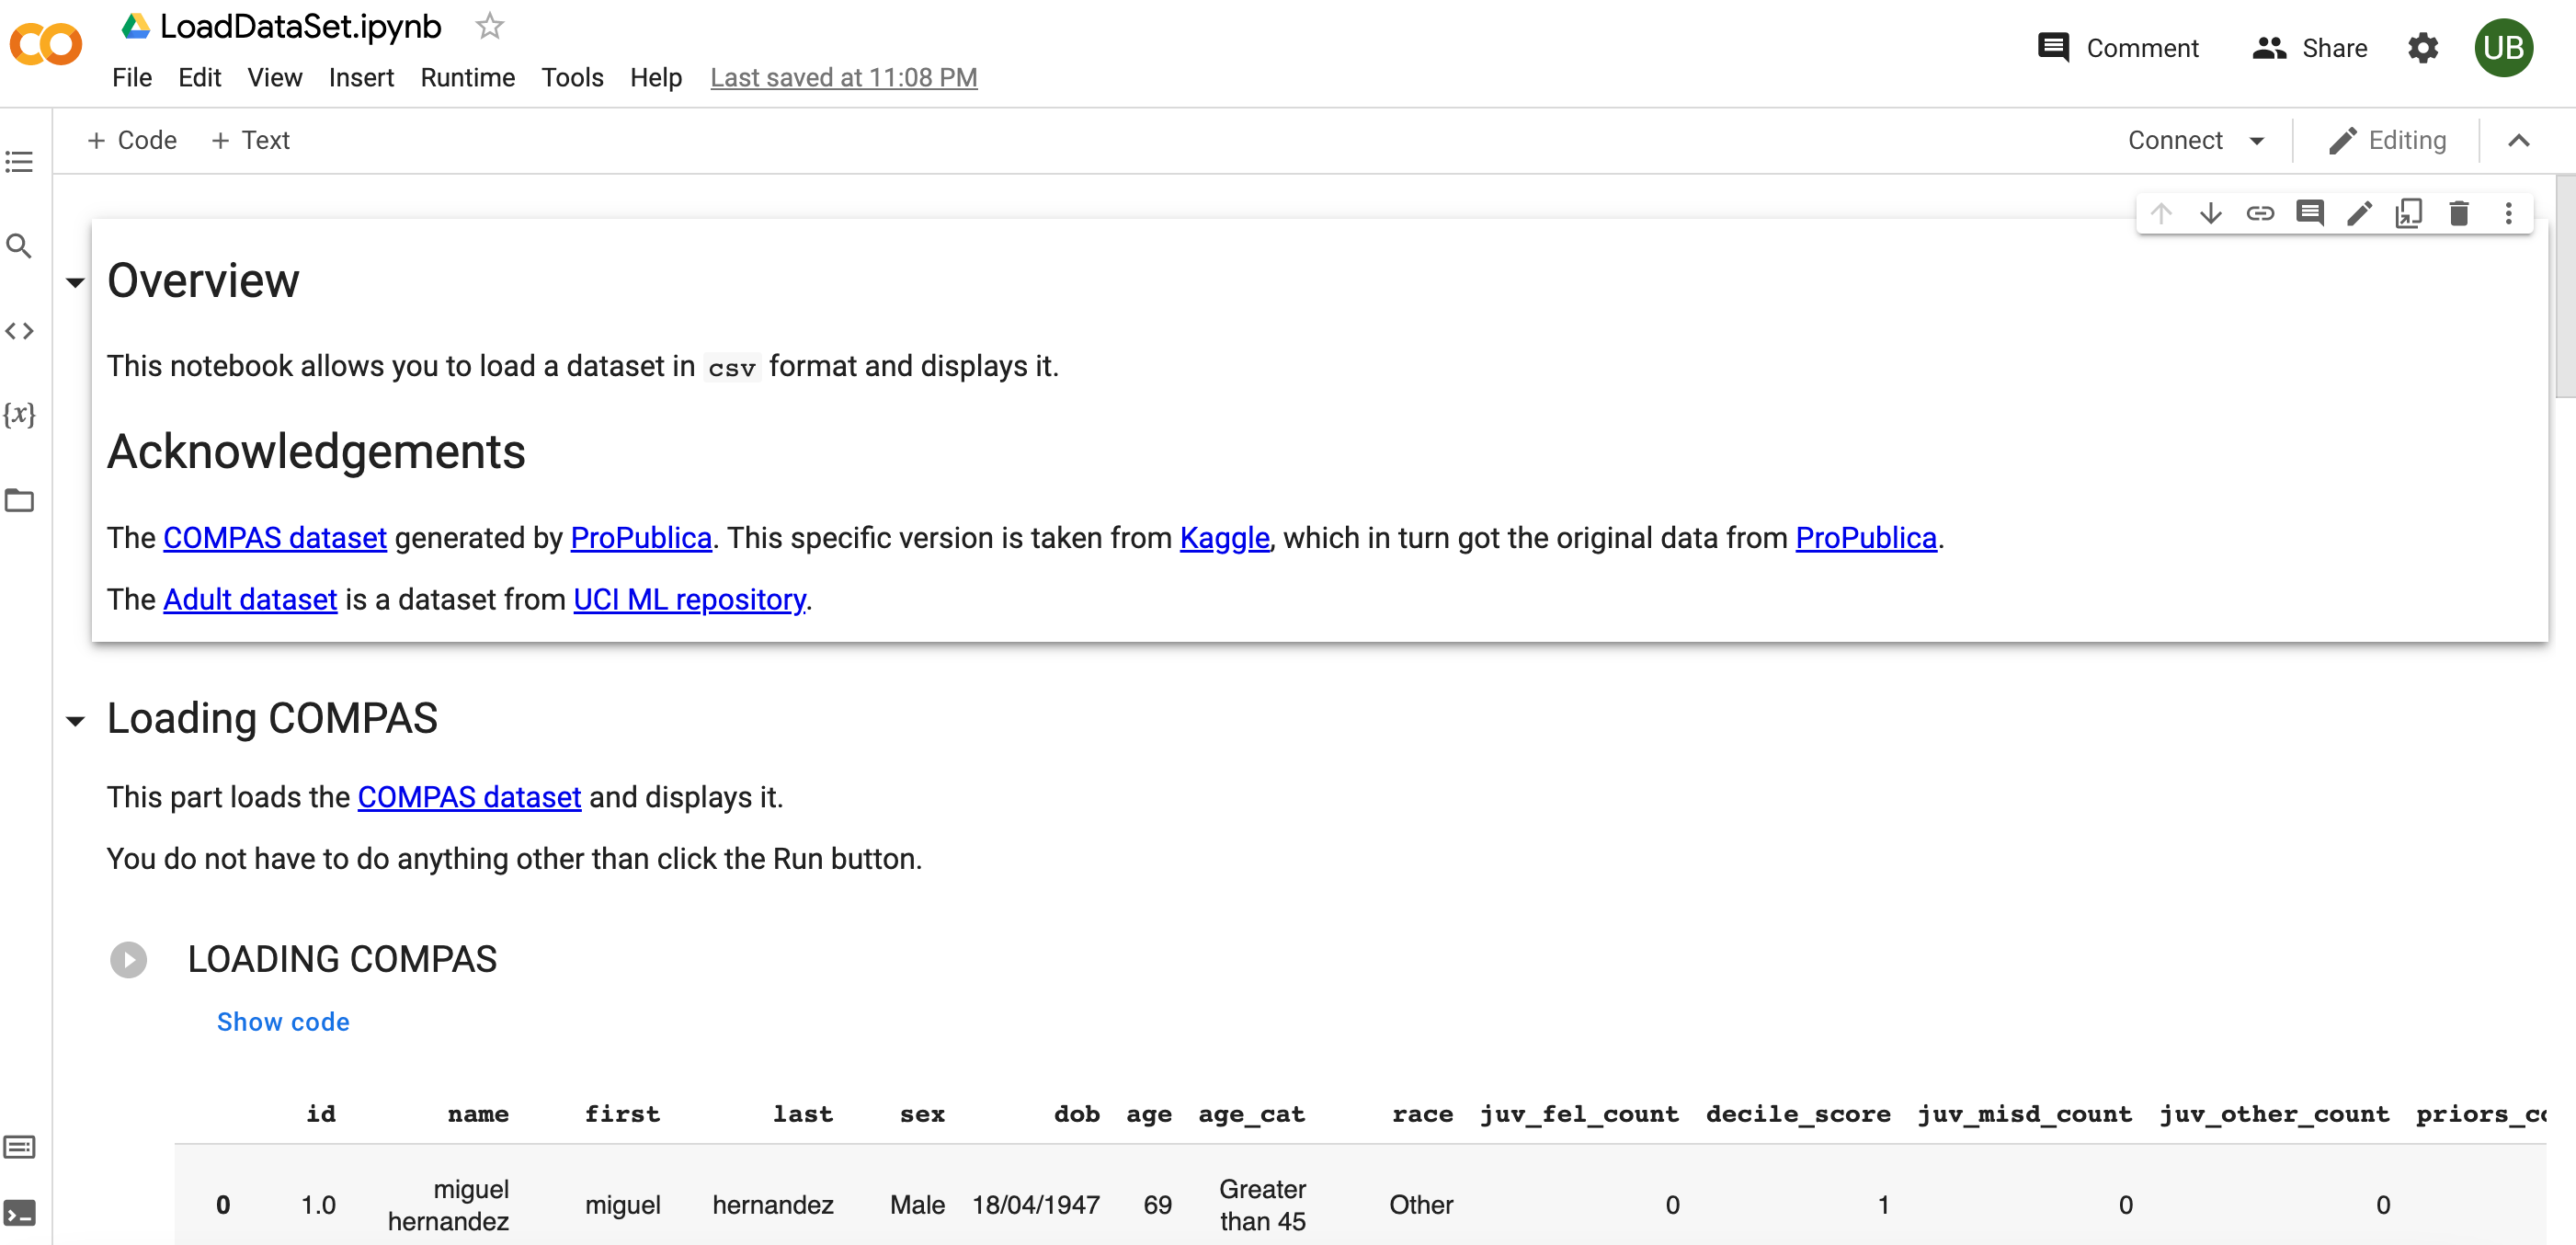
Back to the ML pipeline: Data collection mechanism
At this point, we have figured out the learning problem. Next we have to collect data before we can try and implement the learning problem, which brings us to the fourth step in the ML pipeline:
Data collection mechanism: Example 1
Your group decides to log interactions with ads in the current system.
Data collection mechanism: Example 2
Your group decides to use the existing patient electronic health records (which includes details of the current care the patients receive in your hospital but possibly other details).
Data collection mechanism: In-class exercise
To be done in class.
Data collection mechanism: General thoughts
We first discuss potential issues with the choices made in the first two examples:
- One issue with the use of the existing system to log interactions is that this data cannot capture any potential changes that can happen when you actually apply the system. E.g. your new ad display system itself might change behavior of users and that would mean the data your model was trained on is no longer representative. We must note that this issue with using data is always a possibility and this in fact has its own name-- concept/distribution drift . Of course, if the historical data is indeed representative of future data then this might not be an issue.
- One big potential issue with using existing electronic health records is violation of the privacy of patient records. First, one will need consent from patients to use their records (either explicitly or via a blanket consent that the patients might have signed on when their data was entered in their electronic health records). However, even if the hospital has consent, the outcome of your learning system might leak information about patient data, which in some cases might be problematic (esp. if it becomes public even if indirectly).
One common aspect of both of the above examples is that your group had access to data that either already existed or could be logged from an existing system. However, in many scenarios such an access might not be possible and in such a case the data has to be collected somehow. Here is a non-exhaustive list of some possibilities:
- You could use third-party data. There are third party data vendors from whom you could buy data. Of course in this case you might not have much control over the quality or provenance of your data.
- Your group could decide to collect the data. Again, here is a non-exhaustive list of some possibilities:
- You run a survey to collect data. The question then is whether you run an online survey or you literally have boots on the ground going around to collect data. Both options have their pros and cons.
- In some cases you can install sensors to collect data (e.g. if you were trying to improve the UB stampede experience, you might want to put a senor that can signal to a central system where a certain bus is at any given time.
- Rather than use specialized sensors, you could recruit people to allow the use of their smartphones to collect data (e.g. see the Street Bump , which uses data collected from volunteers while they drive on the road condition and then potentially give information to municipalities to improve road conditions.
- Another way to "crowd-source" data collection is to create a game: e.g. the moral machine experiment that asked player to make moral decisions for self driving cars (do you kill old people vs. kids etc.). As part of the experiment, they were able to collect data on moral decisions that players made and then use it to make some statistical inferences.
Who does your data represent?
One thing that you should always keep in mind is who the data represents and whether that is representative of the population on which you learning system will learn. For example, as in the gender shades example we saw in the introduction, the data used to train facial recognition systems is not representative of the people with darker skins. If you are trying to develop a learning system to predict good employees for future hiring, then the learning system's outcomes will be based on your current employee demographics (if the system was trained on existing employee). This means e.g. if you are a software company, then most likely women are under-represented in your employee roster and hence the learning system that is trained on this data could be biased against women.
let us now walk through the data collection mechanisms that we outlined above and see if they are skewed towards a certain population:
- Offline surveys: If someone is going to knock on doors during business hours in the weekday, then households where everyone is working and/or at school will be under-represented.
- Online surveys: You will be trying to reach folks via some online fashion (e.g. via a email blast) and if a certain demographic is not well-represented in your email list then those folks will be under-represented in your data.
- Sensor data: You can only collected data from locations where sensors are placed. If your sensor placements e.g. are more sparsely populated in certain areas, then those areas will be under-represented in your data.
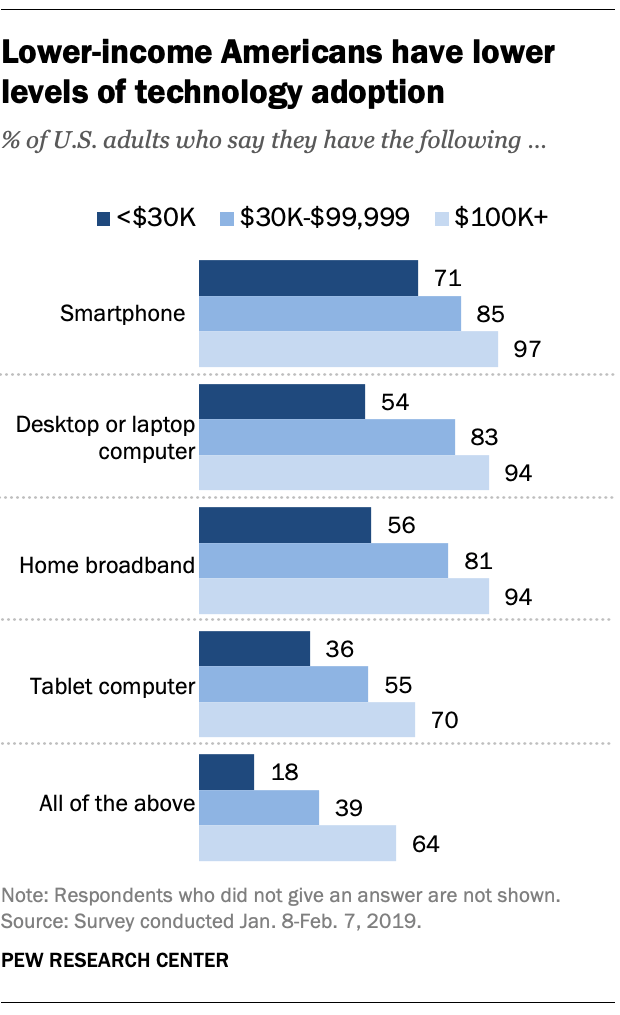
- Smartphone data: This is generally a blindspot for CSE folks since "everyone" has smartphones. However, it is very crucial to question this "fact." According to this Pew Research article , 29% of Americans household incomes of below $30K do not have smartphones:
- Video games: It still surprises me that people are willing to spend time playing games where there is no material benefit (but player get "points") and at the same time giving data for potential use somewhere else. For example US video game players tend to skew young . Add to this questions about who has access to broadband Internet , means that data collected via video/online games will not have much data from certain segments of society.
We will come back to this later in the course.
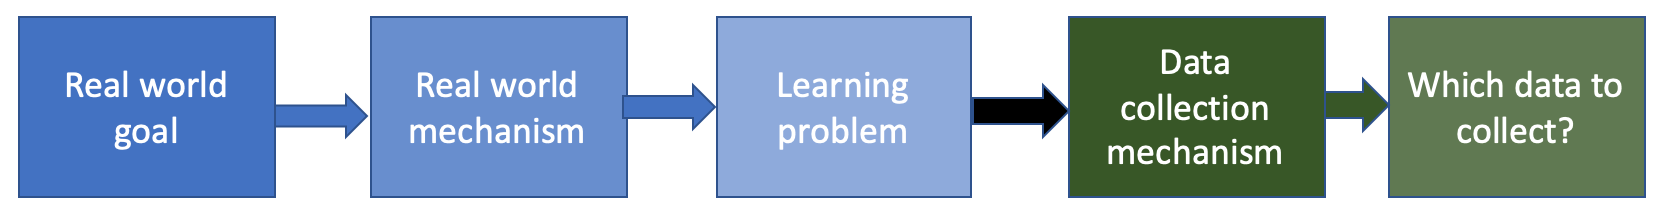
Which data to collect?
We now move to the fifth step in the ML pipeline:
Which data to collect?: Example 1
Even though you have access to the current system, you cannot log everything. This could be because e.g. sorting everything would need a lot of storage or perhaps if the system were to log every action it observes then just the act of logging everything can slow down the system (which is not desirable). For example, your group (as Hal suggests ) decides to log queries (for which ads are generated), ads and clicks.
Which data to collect?: Example 2
In this example,by restricting yourself to electronic health records, you are limiting yourself to what is logged into the electronic health records. One could e.g. try and use doctor's notes to glean more information but these are not necessarily standardized and its not clear how to extract information from doctor's notes. Further, there have been complaints from doctors on the usability of electronic health records , which raises issues about accuracy of data being collected. Finally, for the study that your group is planning will most probably need IRB approval from your hospital, which could in turn restrict which data can be collected/used for your system.
Which data to collect?: In-class discussion
To be done in class.
Which data to collect?: General thoughts
if you are not collecting the data yourself then this step would be moot for your group. However, if your group is actually collecting data than which data you can collect would be related to how expensive/feasible it would be. For example, when doing an offline survey, you cannot expect the respondent to talk for say an hour if a volunteer is knocking on their door asking for their opinion. Of course you can schedule longer offline surveys but in that case it would be expensive to collect a lot of data (you necessarily will need to hire more folks to do the interview)-- not to mention that respondents might not have the time to give detailed answers. (In some cases you might have to offer incentives for respondents to respond to question: e.g. monetary incentives in which case there is a much direct link to expenses and the amount of data collected. If your group is using an online survey then again, the time taken to complete a survey should be on the shorter side since a long survey might have a much lower completion rate.
What the above implies is that for survey (and other data collection methods), one would need to collect specific data/ask few questions that you as a group would deem most important.
In some cases, even though your group might want to collect certain data, it might be sensitive and e.g. survey responders might not be willing to give that information (e.g. date of birth). Even in cases where respondents might be willing to give some information, there might be other institutions constraints that prevent this-- see e.g. the discussion on IRB below.
Institutional Review Board (IRB)
Especially in academic settings, any experiment with human subjects (including data collection of the kind discussed above), has to be approved by an IRB (e.g. here is more information about the UB IRB ). If you need IRB approval, then which data you can collect also will depend on what gets approved by the IRB.
Data representation
We now move to the sixth step in the ML pipeline:
Before we get started with specifics of this step, we take a small digression to convince ourselves that it is not too out there is think of humans as a collections of numbers/strings:
Representing humans as numbers
If you have not seem much of how machine learning systems work in real life scenarios, it might be a bit counter-intuitive to represent humans by (a collection of) numbers (or strings). However, if you are familiar with genomes you would know that every human is defined by their genome, which is a collection of strings with alphabet of A,C,T,G. If you are not, here is quick primer:
Of course your genes by themselves are not enough to predict your behavior. There is the whole "nature vs. nurture" argument--
The above means that human behavior is influenced by their environment and the environment is easier to "measure" for learning systems than human DNA (unless your learning systems has access to human DNA).
Data representation: Example 1
Your group has zeroed in on query, ad and clicks. For the latter perhaps the most natural way to represent this to encode whether a user clicked on ad or not (so either $+$ for clicked and $-$ for not clicked or $1$ for clicked and $0$ for not clicked. The representation for query and the ad is not as straightforward. We could store the exact text for the query and the ad but that seems to indicate issues (e.g. what is you ad text are distinct strings but are essentially the "same" for human consumption or what if someone runs a query that has the same keywords as another query but in different order). To get around these issues of using the text as is, your group decides to use a representation that is more standard in natural language processing: bag of words model .
Data representation: Example 2
In this case since your group is using the electronic health records, then the data representation is pretty much already fixed for your group. Perhaps one exception could be to represent the doctor's notes in the bag of words model as above.
Data representation: In-class discussion
To be done in class.
Data representation: General thoughts
More generally, when creating datasets for learning systems you convert "raw" data into specific representations. The primary reason to do this is that there can be a lot of variation in "raw data" but using a slightly coarser representation (that technically "loses" some information) is more useful to compare various entries in your dataset. As we saw above for the first example, even though one could store the raw text of the query doing so makes things harder down the line and so we decided to use the bag of words model to represent the query.
Sometimes the representation could be mandated by your data collection mechanism. E.g. in electronic health records, diseases, symptoms and so on are represented by diagnosis code . Sometimes, the representation could depend on the instrument used to measure something (e.g. temperatures in medical records are not recorded to arbitrary precision but based on the precision of the thermometers used. If using online surveys, the data representation would depend on how the responses are collected-- e.g. are they free-form text or are they input as a check=list. In the latter case there are only fixed number of possible values (and this in statistics is referred to as a categorical data/variable .
A digression: A Jupyter notebook exercise
Before we move on, let's use Jupyter notebook to get a sense for how which data you collect can affect your accuracy at the end:
Load the notebook
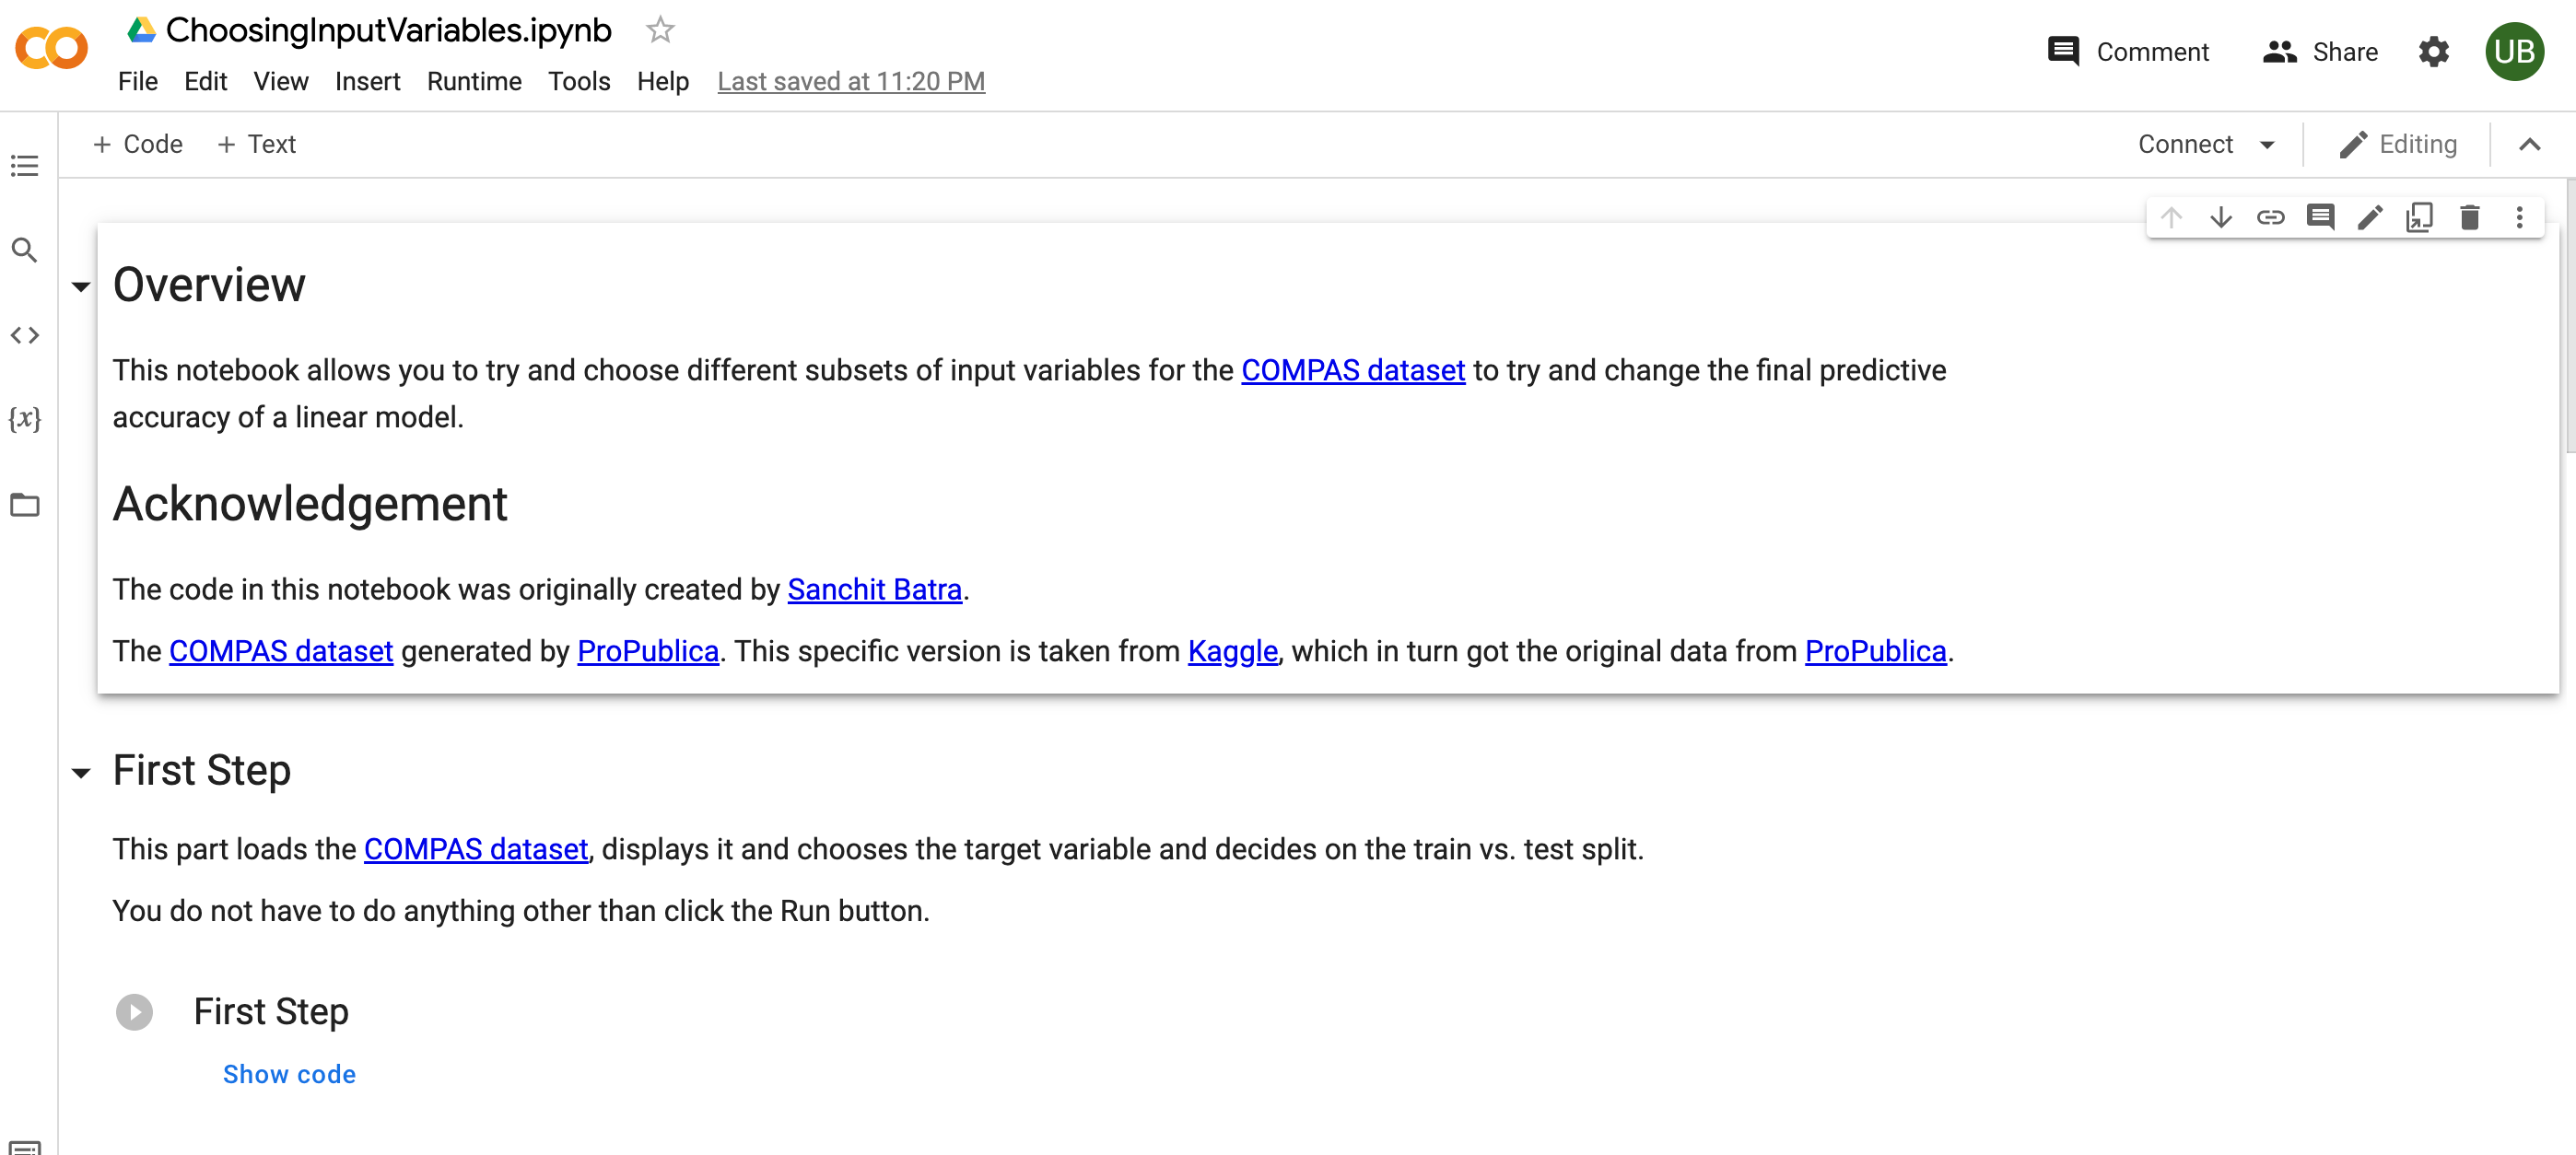
Log on to Google Colab . Then download the Choosing Input Variables notebook from the notebooks page (here is a direct link). Load the notebook into Google Colab , which would look like this:
Ignore most of the notebook
The notebook trains a linear model on the COMPAS dataset but you can ignore most of the notebook safely for now. Pay attention to two things:
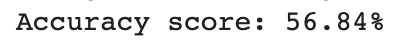
- At the very bottom of the notebook states the accuracy of the linear model (where we are training on a random $80\%$ subset of the dataset and the accuracy is measured on a random $20\%$ random sample as the testing dataset):
- look for the "cell" titled
Choose your input variables. This is the first cell with selection widget like this: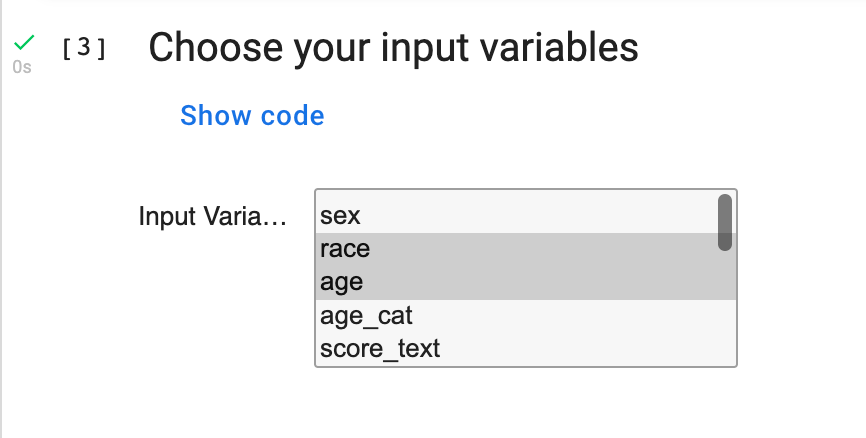
Play around with removing/adding various input variables/column names and see how the accuracy changes at the bottom of the notebook.
Increase the accuracy
Can you pick a set of input variables so that the accuracy gets to as close to $100\%$ as possible?
BONUS: Decrease the accuracy
Pick a subset of eight variables so that the accuracy is as close to $0\%$ as possible. The submission with the lowest accuracy will get 5 bonus points. More (submission) details on the Bonus page.
Do not forget to run each cell in sequence
A common way to get an error message is to run cell out of order. When in doubt, start with the first cell and then run all of them in sequence.
Next Up
Next, we will looks at some well-known (and widely used) machine learning models (i.e. dive deeper into the seventh step of the ML pipeline).